Everything you need to
validate and monitor your strategies
Four integrated modules. 100+ metrics. Real-time monitoring.
From upload to insight in 60 seconds.
Upload your backtest. Get 100+ metrics instantly.
Plain-English insights in 60 seconds. No spreadsheet skills required.
Everything you need to understand your strategy
Performance Metrics
Get a complete picture of your strategy's performance with key metrics like profit factor, Sharpe ratio, win rate, and average trade.
Distribution Analysis
Understand the statistical distribution of your trades. See histograms, probability curves, and identify outliers.
Performance Metrics
Get a complete picture of your strategy's performance with key metrics like profit factor, Sharpe ratio, win rate, and average trade.
- •Profit factor and return on investment
- •Win rate and average win/loss
- •Risk-adjusted returns (Sharpe, Sortino)
- •Maximum drawdown and recovery time
Distribution Analysis
Understand the statistical distribution of your trades. See histograms, probability curves, and identify outliers.
- •Trade distribution histograms
- •Probability density functions
- •Outlier detection and analysis
- •Statistical moments (mean, variance, skewness)
Strategy Health Scoring
Our proprietary scoring system evaluates multiple factors to give you a single health score for your strategy.
- •Multi-factor health assessment
- •Risk-adjusted performance scoring
- •Consistency and reliability metrics
- •Actionable improvement recommendations
AI-Powered Insights
Get intelligent insights about your strategy's strengths and weaknesses, powered by advanced analytics.
- •Automated pattern detection
- •Anomaly identification
- •Performance trend analysis
- •Personalized recommendations
100+ metrics across 8 categories
Returns
12 stats
Risk
14 stats
Trade Analysis
15 stats
Time Analysis
10 stats
Streaks
8 stats
Drawdown
14 stats
Statistical
12 stats
Quality
11 stats
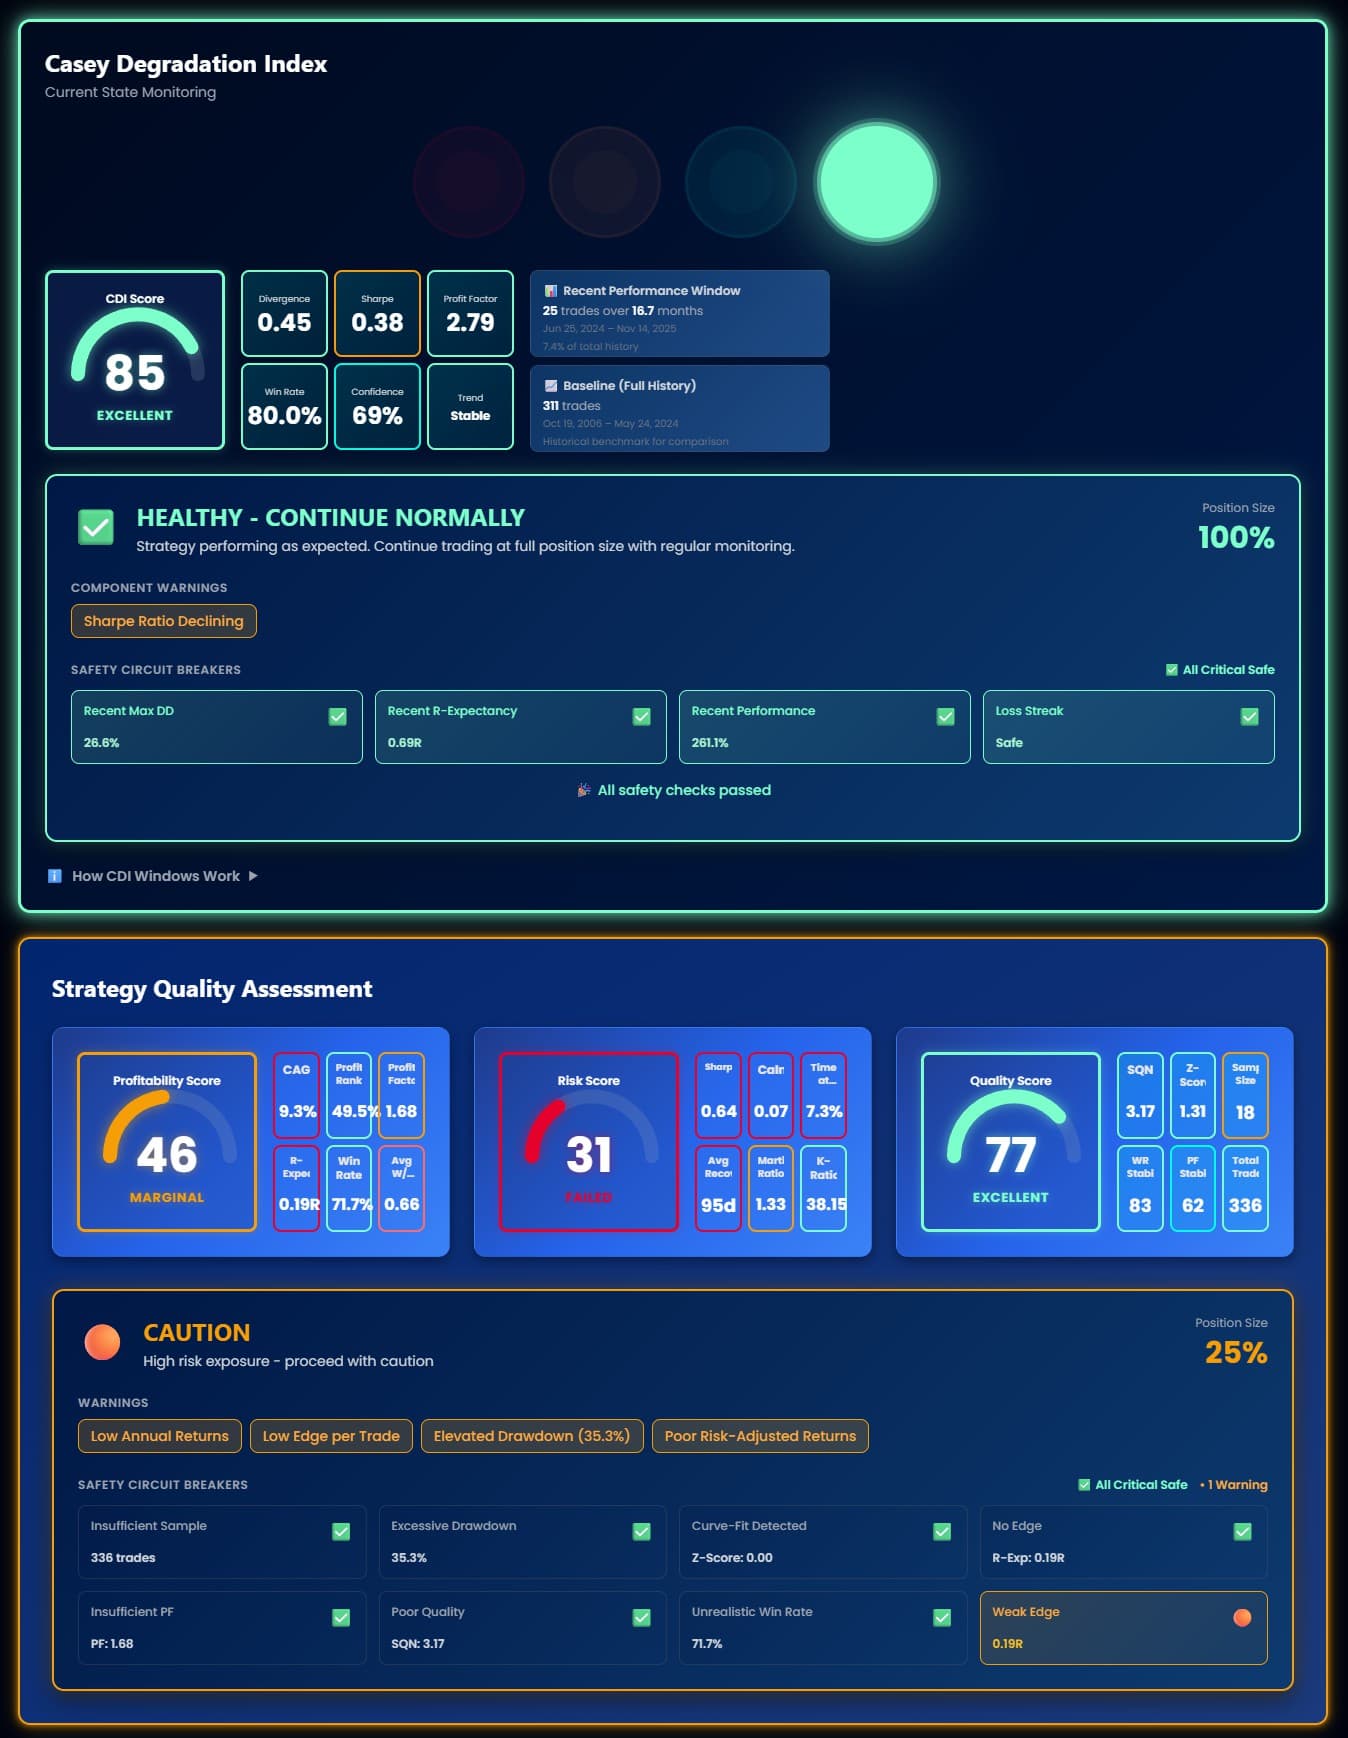
Real-time strategy health monitoring
The only platform that automatically tracks when your strategy starts breaking.
Get alerted before losses pile up.

Automated Degradation Detection
CSI scoring (0-100) tracks your strategy against statistical expectations. When performance drifts beyond normal bounds, you get alerted.
4-Tier Health Grading
Clear recommendations: Excellent, Good, Fair, or Poor. Know immediately whether to continue, monitor closely, adjust, or pause.
Live vs Expected Comparison
See how your live results stack up against backtest expectations in real-time. No more Excel spreadsheet tracking.
No competitor offers this
Backtesting platforms can't monitor after export. Journaling platforms only records what happened.
AlgoChef is the only platform that validates robustness AND monitors degradation.
“You could spend 4 hours/week tracking probability cones in Excel like others teaches—or let AlgoChef do it automatically.”
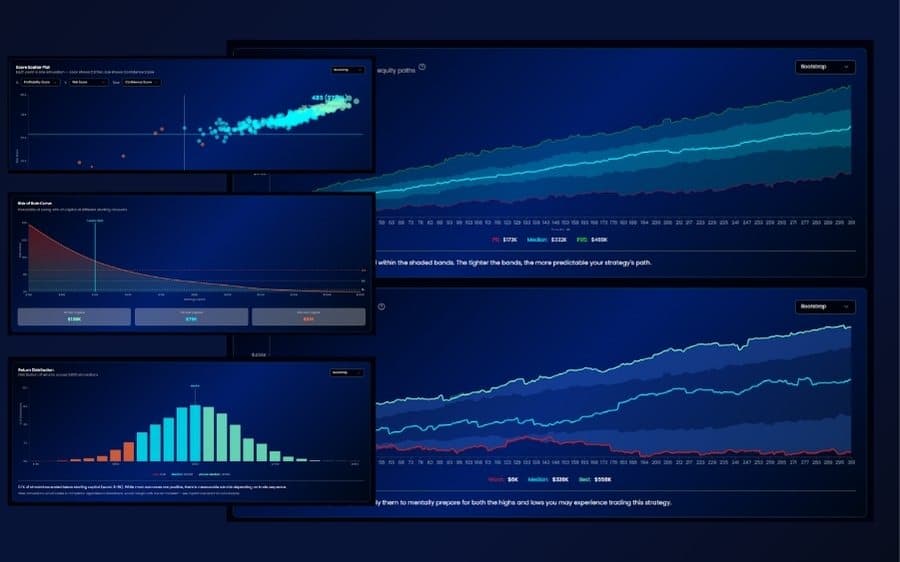
Stress-test with 250,000 simulations
Know if your edge is real or just luck. Run comprehensive simulations in seconds.
Five simulation methods for different insights
Each method reveals a different aspect of your strategy's robustness. Use them together for a complete picture.
Random Shuffle
Randomly reorders your trades to test how sequence affects performance. Great for understanding path dependency and seeing best/worst case equity curves.
Drawdown Analysis
Understand the worst-case scenarios your strategy might face. See maximum drawdown distributions and recovery probabilities.
- •Maximum drawdown distributions
- •Drawdown duration analysis
- •Recovery time probabilities
- •Peak-to-valley metrics
Risk of Ruin Calculation
Calculate the probability of losing your entire trading capital under different scenarios and position sizes.
- •Probability of ruin calculations
- •Position sizing recommendations
- •Capital requirement analysis
- •Risk tolerance assessment
Capital Requirements
Determine the minimum capital needed to trade your strategy safely, accounting for drawdowns and margin requirements.
- •Minimum capital calculations
- •Margin requirement analysis
- •Capital efficiency metrics
- •Safety buffer recommendations
Portfolio Studio
Coming Soon
Combine strategies and optimize allocation. See how they work together.
Correlation Analysis
Trade Only N of M Strategies
What-If Scenarios
Allocation Optimization
Be the first to know when Portfolio Studio launches
Stop guessing.
Start knowing.
Join the waitlist for free beta access. Be first to validate your strategies with institutional-grade tools.
Trade smarter with institutional tools—no guesswork, no barriers.